
Find where gamma stacks up.
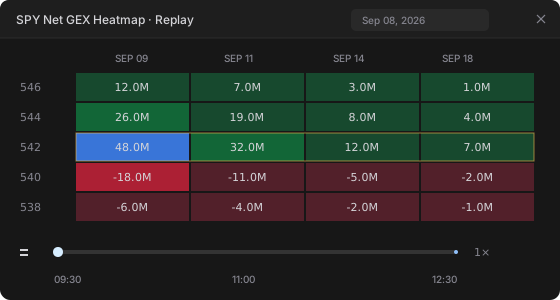
Scan exposure by strike and expiration. The heatmap puts positive and negative gamma in view, with the largest node highlighted so you can spot it quickly.
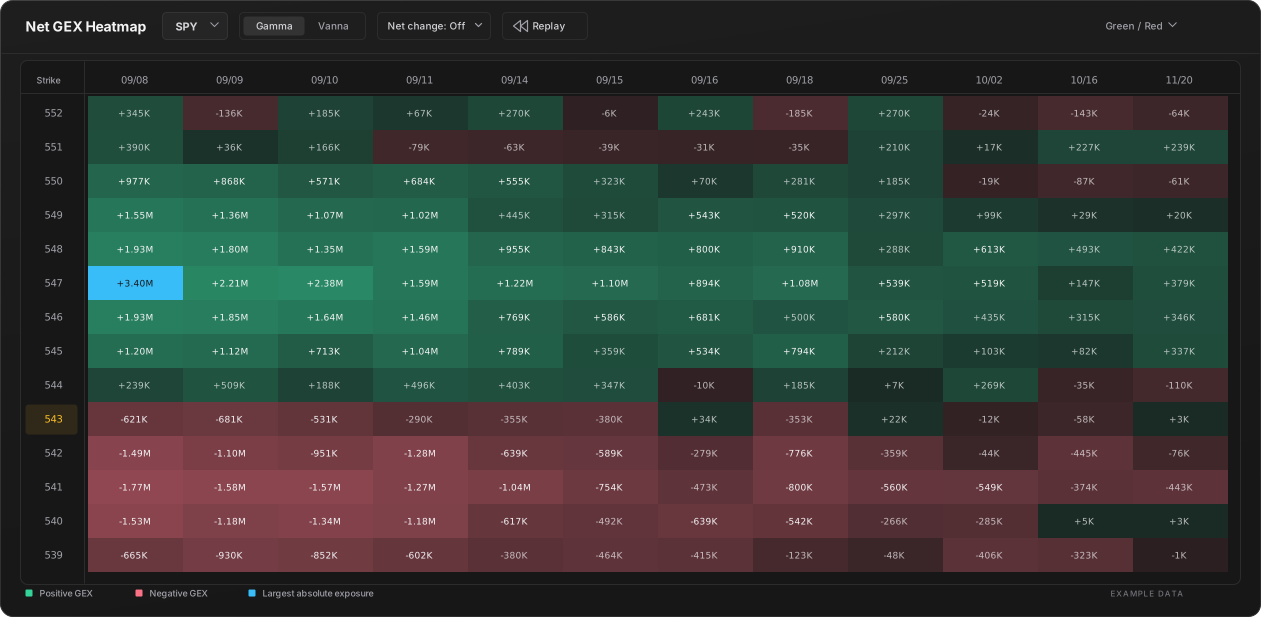
Bring live GEX heatmaps, key levels, and dealer positioning into one clear view. See where exposure is concentrated and how it changes as the session unfolds.
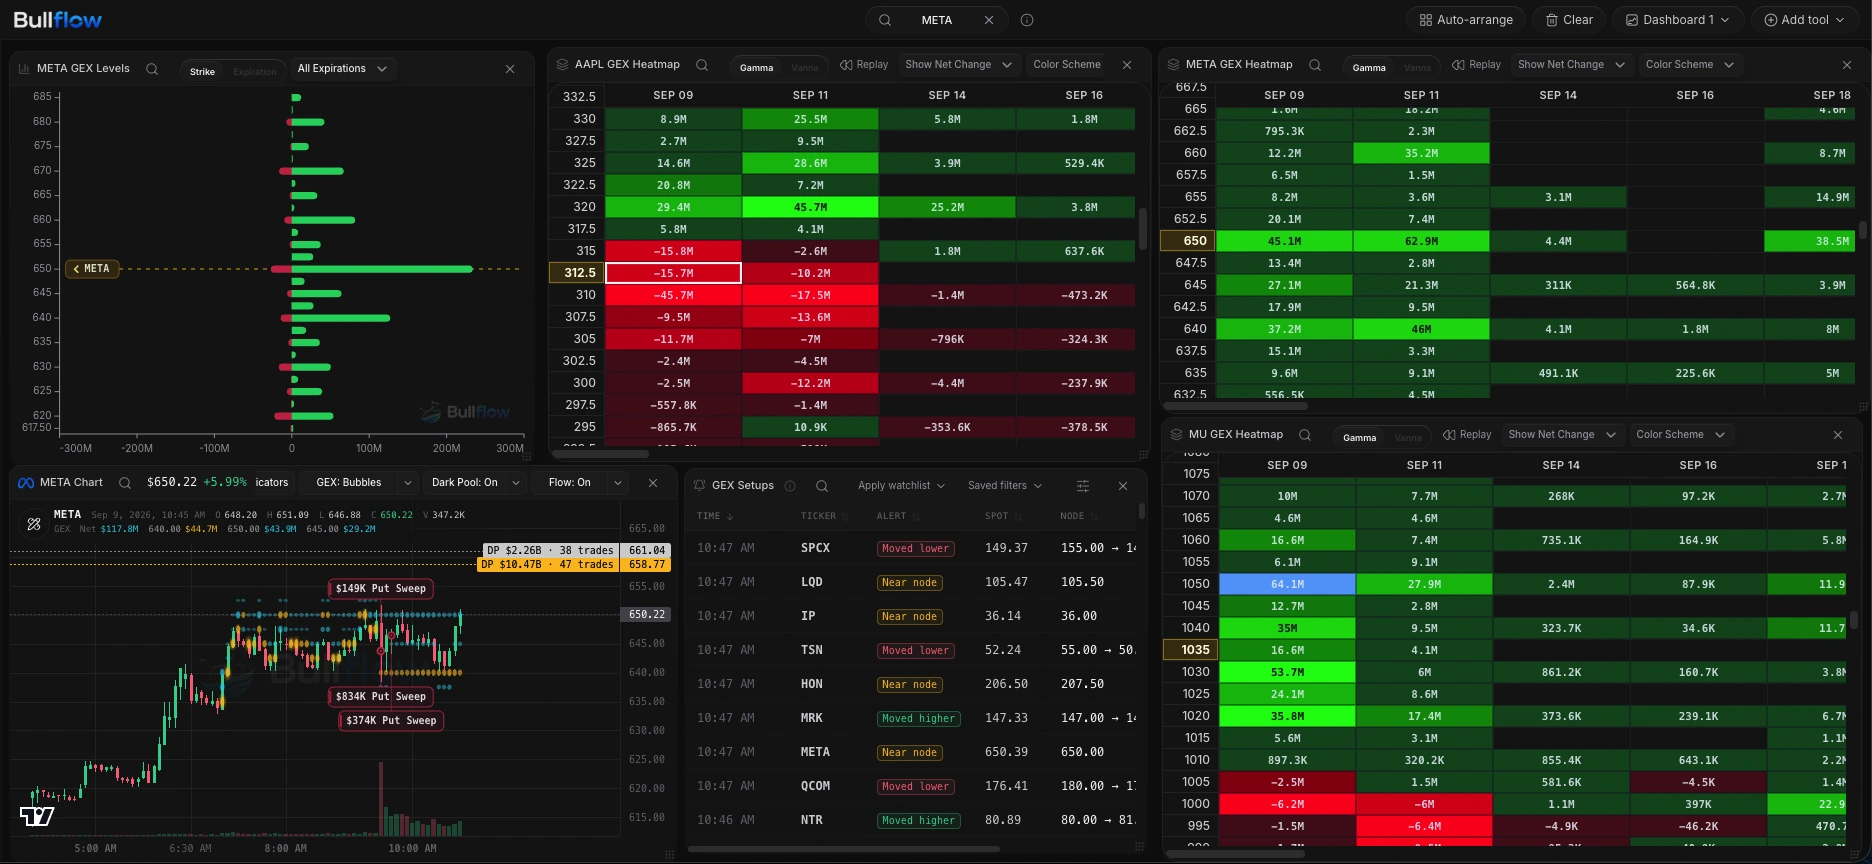
Find the concentrations. Follow the shifts. Build your view of the market.
Go from a market-wide view to the strikes you care about. Keep the tools you need close, and make the workspace yours.
Scan exposure by strike and expiration. The heatmap puts positive and negative gamma in view, with the largest node highlighted so you can spot it quickly.
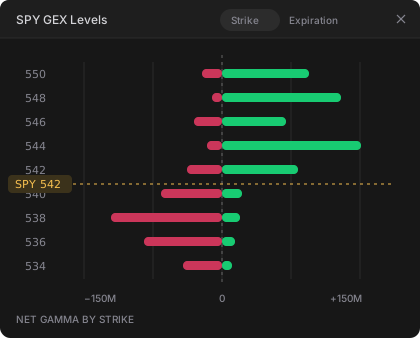
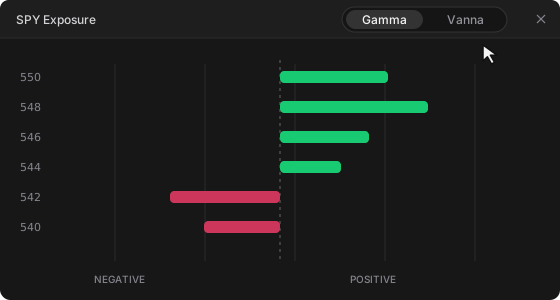
See positive and negative gamma around spot. Put potential pressure points and gamma walls into perspective before you plan your trade.
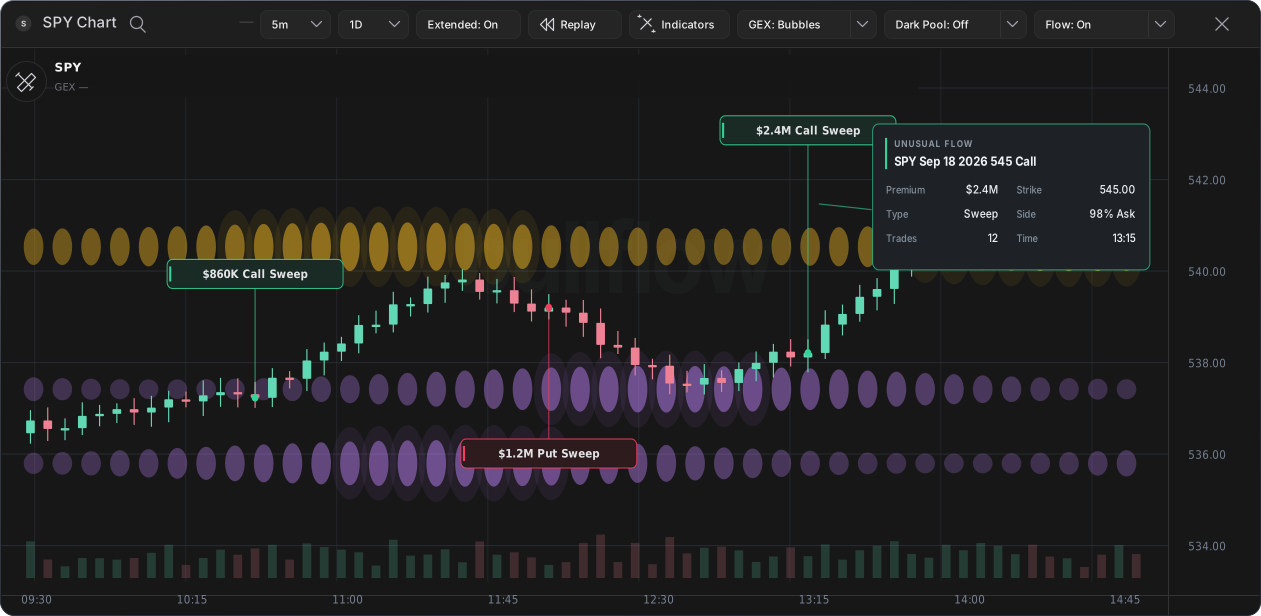
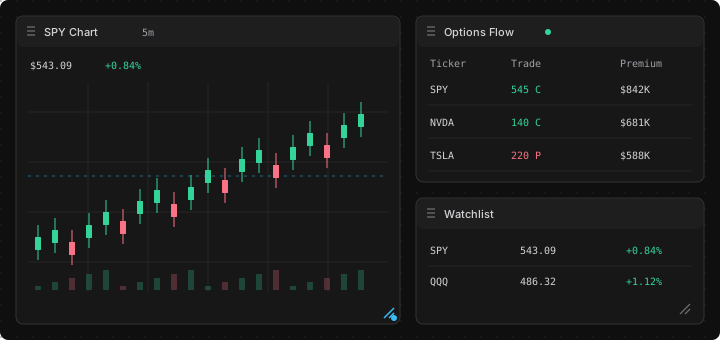
Overlay GEX on live candles. Follow positioning alongside price, options flow, and dark pool activity without piecing together separate views.
Follow GEX alerts when price approaches a key node or the largest node moves. Keep changing levels on your radar.
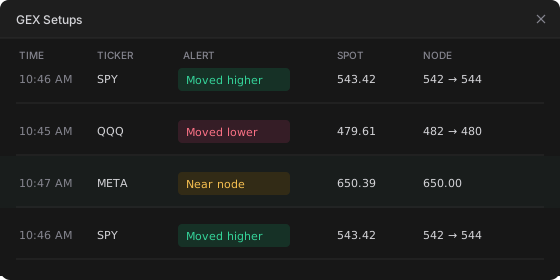
Replay a past session and watch exposure develop over time. Study how the levels shifted instead of relying on a single snapshot.
Switch between Gamma and Vanna exposure in the same view. Add another layer of positioning context without changing your workflow.
Compare tickers side by side. Add heatmaps, levels, charts, and alerts, then drag, resize, and save the layout that works for you.
Replay, Vanna, alerts, and multi-map layouts are available on select plans. Compare plans
Gamma exposure estimates how dealers may adjust their hedges as price moves. Use it alongside price action, options flow, and your own risk plan.
Read the GEX tools guideExposure levels are modeled market context, not guaranteed support, resistance, or price targets.
View GEX by strike and expiration for the S&P 500 index.
Track SPY net gamma, the gamma flip, and major GEX levels.
View QQQ gamma exposure by strike and expiration.
Gamma exposure (GEX) estimates how dealers may adjust their hedges as the underlying price changes. Combined across strikes and expirations, it shows where that hedging pressure may be concentrated.
A GEX heatmap shows net gamma by strike and expiration. Color highlights where positive and negative gamma are concentrated.
In positive gamma, dealer hedging tends to push against price moves. In negative gamma, it tends to move with them. These are modeled conditions, not price predictions.
The gamma flip is the modeled price where total dealer gamma changes sign. It helps traders gauge whether hedging may dampen or amplify price moves.
Traders compare large GEX levels with spot price, options flow, and their risk plan. The levels can mark potential pinning zones or pressure points, but they are not guaranteed support, resistance, or targets.
Yes. Bullflow supports major indices and ETFs—including SPX, SPY, and QQQ—plus many optionable stocks. Coverage and advanced features vary by symbol and plan.
Keep gamma exposure, live levels, and the tools you need in one place.
We use optional analytics and marketing cookies to improve Bullflow and measure campaigns.