
You see the price.
Now see the flow.

Without options flow, you’re missing a layer of the market. Find your next trade idea in unusual activity. Bullflow makes it stand out.

Illustrative Bullflow options feed showing trades, premiums, and SigScore rankings

Options Flow isn't just institutions "Hedging".
It can show real directional trades placed by smart money.

You just need to know what to look for.

Watch the demo

Less digging. More discovery.

A big trade isn’t always unusual.
Know what deserves a closer look.

The Bullflow algorithm ranks unusual activity, cuts the noise, and puts the context one click away.

Unusual, ranked.

SigScore ranks trades by how unusual they are. Spot the standouts without reading every print.

Animated sample SigScore bars filling from 0.18 in red to 0.97 in bright green, matching the Bullflow grid cells

Less noise. One switch.

Switch to Focus for a more selective feed. Spend less time scanning and more time sizing up ideas.

Animated illustration of a cursor switching between Full Flow and Focus

Let the ideas come to you.

Algo alerts flag notable contracts. A starting point for your next trade idea.

Animated Flow Alerts feed showing new sample options alerts arriving with contracts, premiums, and peak returns

Institutional moves, straight to your phone.

Set custom alerts for your criteria. Get notified when matching flow hits.
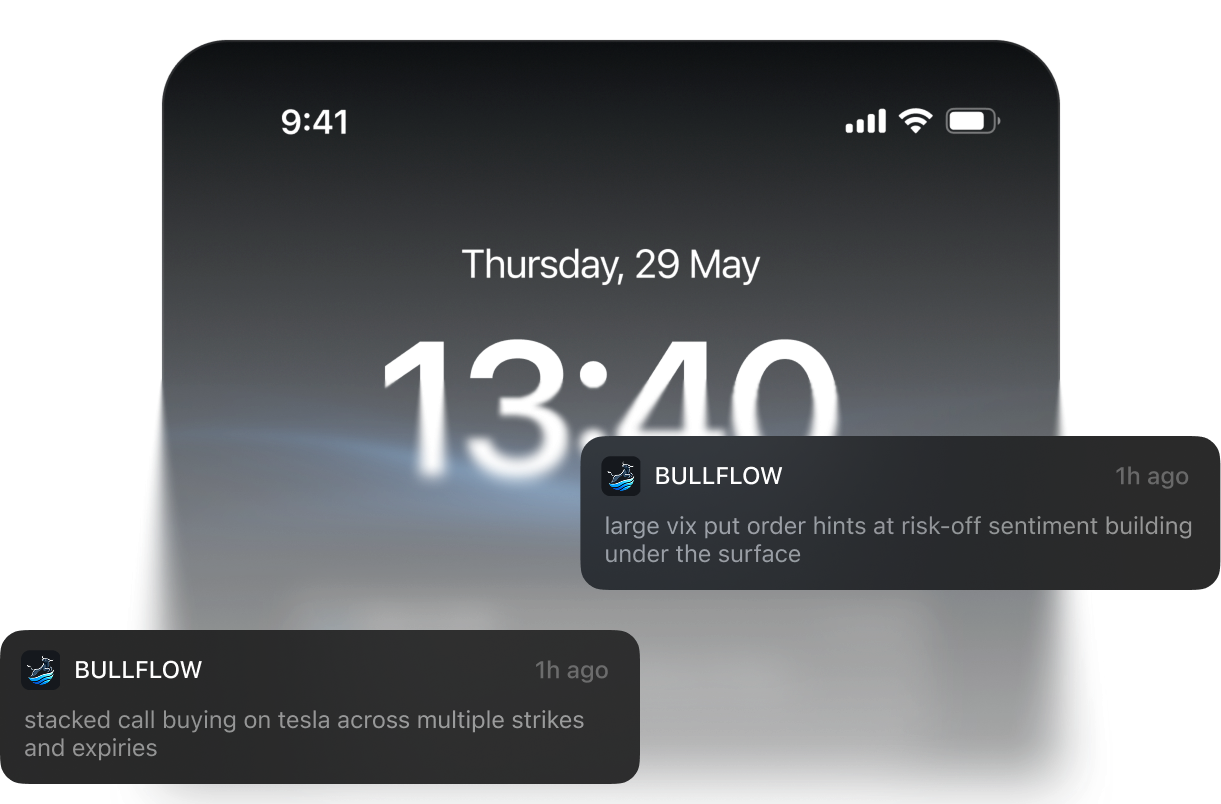
Custom Bullflow options flow notifications on a phone

Follow the pressure.

Net premium adds buying and selling context. See how the flow develops beyond one trade.

Animated sample net premium chart with green net call premium, pink net put premium, and a gold INTC price line drawing across the session
Illustration with sample data

Charts that show the institutions piling in

Open the contract chart from an alert. Put the idea next to the price action.

Animated sample contract chart with stacked bid, mid, and ask volume, a gold price line, and trade entry and peak markers
Illustration with sample data

One trade. Every next step.

Click a trade to pull up details, isolate a contract, or jump into charts. Keep your next move close.

Animated illustration of a cursor opening a BA trade menu and clicking Isolate Ticker to show only BA trades
Illustration with sample data

Your chart is only part of the picture.
Add the flow.

Spot unusual activity. Build a better watchlist. Find your next idea.