 Bullflow
Unusual Options Activity: The Complete Guide to Options Flow

A 7-Part Lesson: How to Read Options Flow, Identify Meaningful Activity, and Separate Signal From Noise
Unusual options activity is options trading that stands out from a contract’s normal pattern, such as volume well above open interest, unusually large premium, or repeated aggressive orders in one contract. Options flow is the live record of those trades. Ever wonder why a stock suddenly makes a massive move before the news comes out? Or why certain options contracts see millions of dollars in trading activity seemingly out of nowhere?
Sometimes, an early clue appears in the options market. Every day, institutions, market makers, and retail traders transact enormous amounts of options premium. Some activity represents speculation; other trades involve hedging, spreads, or closing positions. Unusual options flow helps traders identify the transactions that stand out and investigate what they might mean.
By studying trade size, timing, execution, concentration, and the underlying stock, you can turn a noisy stream of transactions into a more structured research process. This guide teaches the fundamentals and then shows you how to apply Bullflow's five-criteria flow framework.
What you'll learn:
- What unusual options flow is and why it matters.
- How to read the fields in an options flow trade.
- How to interpret bullish and bearish activity.
- The five criteria behind Bullflow's Five-Criteria Flow Cheat Sheet.
- How to spot false signals and misleading flow.
- How to analyze activity with Bullflow.
- How to build a repeatable trading workflow around flow.
Lesson 1: What Is Unusual Options Activity?
What is options flow?
Options flow is a live record of options transactions across the market. Each transaction typically includes the ticker, call or put designation, strike, expiration, contracts traded, execution price, premium, and execution relative to the bid and ask.
Flow scanners organize these trades into a feed so traders can observe where options activity is developing across stocks, ETFs, and indices.
What makes activity unusual?
A large trade is not always an unusual trade. A multimillion-dollar transaction in an actively traded index ETF may be routine, while a much smaller order in a thinly traded stock can be striking.
Unusual behavior may include unusually large premium, volume relative to open interest, repeated trades in the same contract, aggressive executions, or activity at less-frequently traded strikes and expirations. What matters is the activity relative to its normal context, not simply the absolute amount of money involved.
One way to determine how unusual the activity is involves comparing the premium being traded to the stock's historical average. Bullflow's “$ Avg.” metric shows the average daily options premium for a stock, providing a useful benchmark for identifying activity that stands out from the norm.

Who is behind the flow?
Retail traders transact options for speculation, protection, and income. Institutions may trade for directional exposure, portfolio hedging, volatility exposure, and risk management. Market makers provide liquidity and may hedge their exposure with stock, futures, or other options.
The tape does not name the ultimate decision-maker or disclose their full portfolio. A large print cannot by itself establish that a hedge fund made a bullish bet.
Why traders watch it
Suppose NVDA is at $180 and repeated purchases appear in $190 calls expiring several weeks later. Many executions take place near the ask, options prices rise, and the underlying stock begins moving toward resistance. That combination could justify closer research. It does not guarantee a rally.
Lesson 1 takeaway: Unusual flow is a discovery tool. It highlights activity worth examining, not signals that automatically predict a stock's next move.
Lesson 2: How to Read an Options Flow Trade
Breaking down the contract
Consider this hypothetical trade:
NVDA | $190 Call | December 18 Expiration | 500 Contracts | $2.40 Option Price
For a standard equity option, each contract ordinarily controls 100 shares. The total premium is therefore:
500 × $2.40 × 100 = $120,000
Premium is the value exchanged in the options transaction. It does not necessarily equal a trader's total position risk or tell you whether the trade is part of a larger structure.
Bid, ask, and midpoint
Suppose an option is quoted at $2.30 bid / $2.40 ask, with a $2.35 midpoint.
- At the ask: An aggressive buyer may be accepting the seller's offer to obtain an immediate fill.
- At the bid: An aggressive seller may be accepting the buyer's bid to execute promptly.
- Near the midpoint: Intent is more ambiguous; negotiated or multi-leg transactions may be involved.
The quote/trade pairing is an estimate of who initiated the transaction. It cannot conclusively prove whether the buyer or seller opened or closed a position.
Options volume vs open interest
Volume counts contracts traded during the session. Open interest (OI) counts outstanding contracts, generally updated after the daily clearing process.
Imagine an option has 300 contracts of OI and trades 2,500 contracts today. That is noteworthy turnover, but it does not prove 2,500 new contracts were opened. Contracts can change hands repeatedly. Reviewing the following day's OI can add context, although even that is not a perfect reconstruction of intraday positioning.
Opening vs. closing: what can you actually know?
A trade reported at the ask may be buyer-initiated, but we won’t know for certain whether the buyer opened a new long position or closed a short one until we can verify with open interest.. Open interest is calculated after clearing and reflects both sides of the transaction.
- Both buyer and seller open: open interest increases by the number of contracts.
- One side opens while the other closes: open interest is unchanged.
- Both buyer and seller close: open interest decreases by the number of contracts.
Example: If open interest rises from 300 to 1,000 overnight, the net increase is 700 contracts. That suggests more contracts were opened than closed over the clearing period, but it does not identify which intraday trades were responsible or whether the net exposure was bullish.
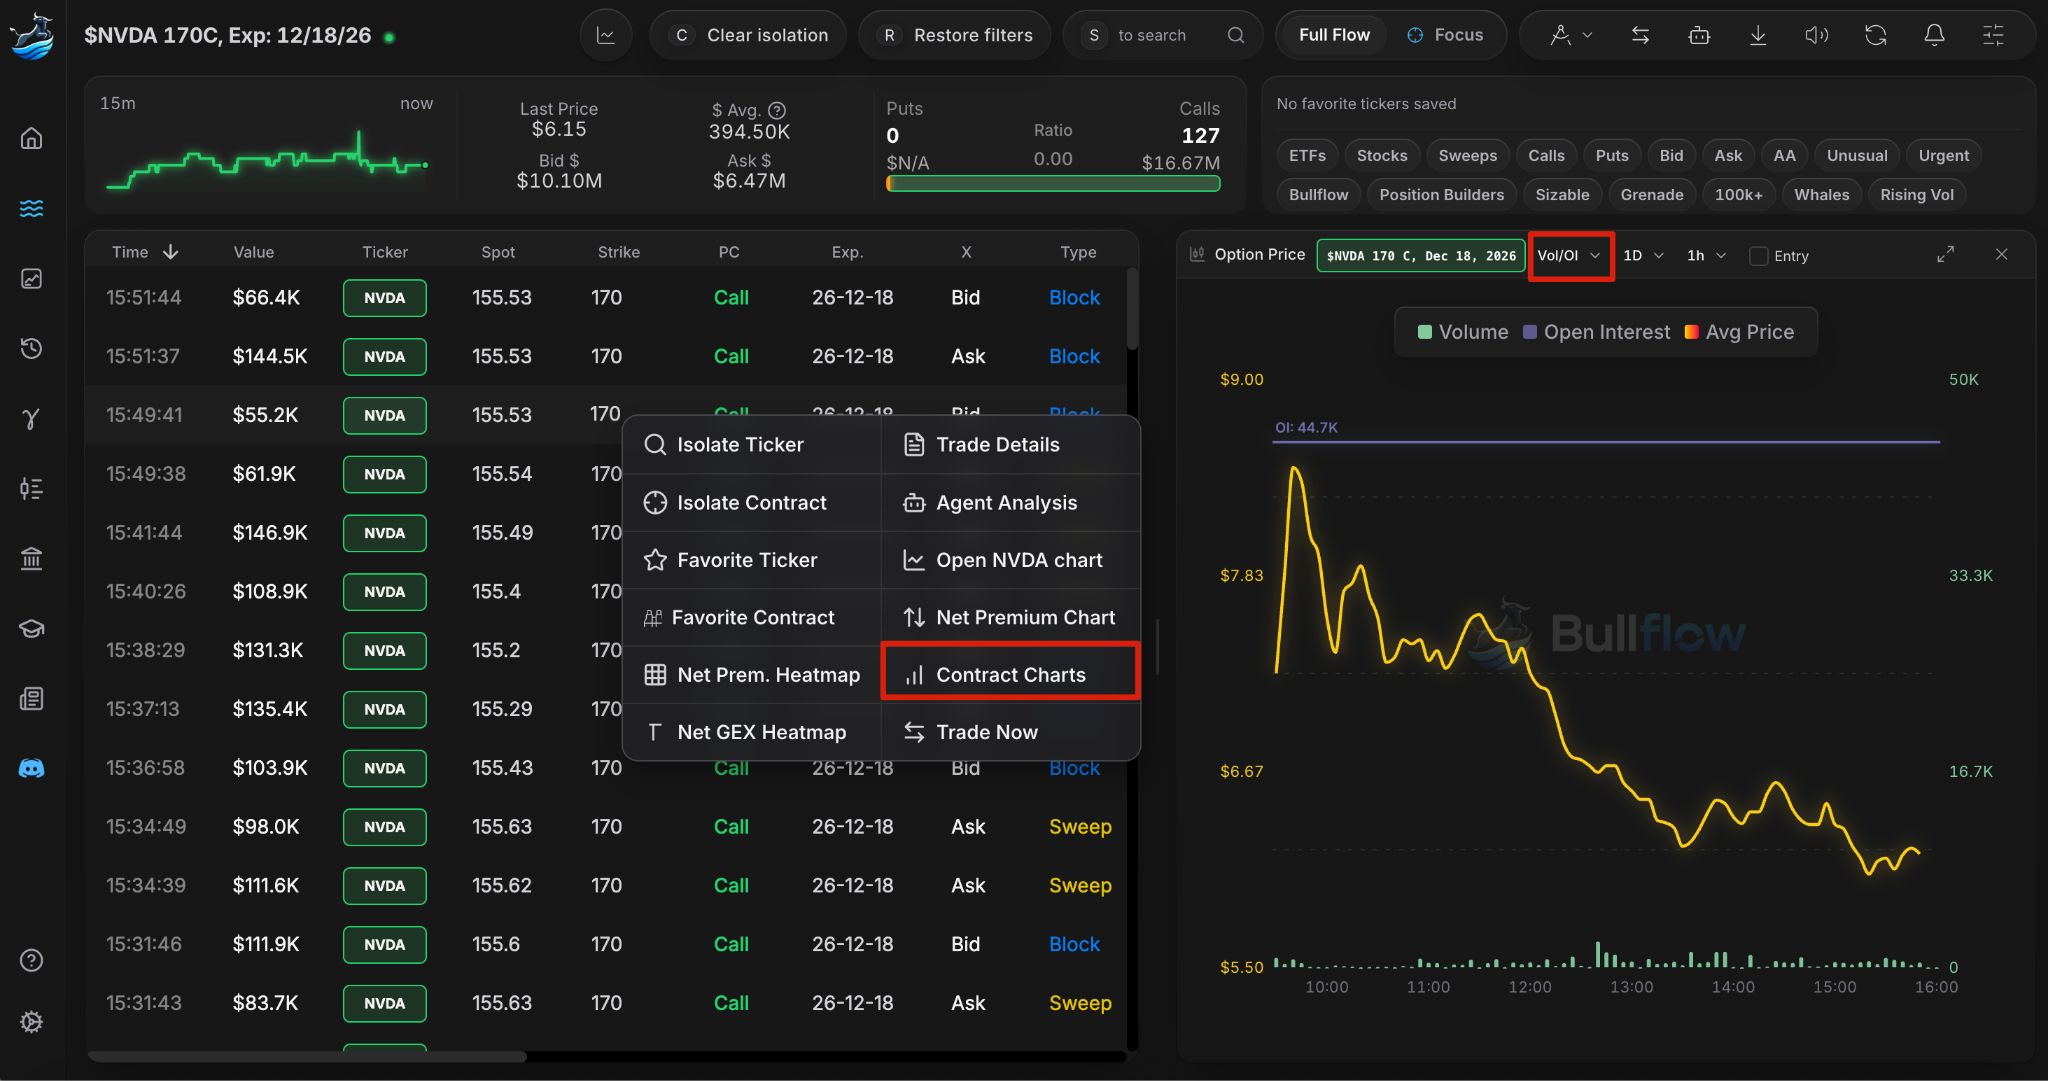
Bullflow’s Contract Charts allow you to track trading volume and open interest for individual options contracts:
ITM, ATM, and OTM: the strike changes the story
- In the money (ITM): A call has intrinsic value when its strike is below the stock price; a put is ITM when its strike is above the stock price. Deep-ITM flow may be tied to stock substitution, hedging, or dividend mechanics.
- At the money (ATM): The strike is near the stock price. ATM options commonly have substantial time value and are sensitive to volatility and near-term movement.
- Out of the money (OTM): A call strike is above the stock; a put strike is below it. OTM contracts may offer leveraged directional exposure, but they can expire worthless even if the stock moves in the predicted direction.
For a $100 stock, a $90 call is ITM, a $100 call is ATM, and a $110 call is OTM. Always evaluate the strike relative to spot, the remaining days to expiration, and the actual option price.
Sweep orders vs block trades
A sweep (often an intermarket sweep order, or ISO) accesses liquidity across multiple exchanges or execution venues, often with speed as a priority. A block is a relatively large transaction executed as one reported fill. Sweeps can demonstrate urgency, and blocks can demonstrate size, but either might be part of a hedge, spread, or closing transaction.
Expiration changes the meaning
A $1 million call purchase expiring tomorrow has a very different risk and timing profile from one expiring six months out. Consider days to expiration (DTE), time decay, possible events, and how much the underlying would need to move for the trade to work.
Lesson 2 takeaway: Read premium, bid/ask position, volume, OI, execution type, and expiration together, never in isolation.
Lesson 3: Identifying Bullish and Bearish Options Flow
Calls do not automatically mean bullish. Puts do not automatically mean bearish.
The simplified interpretations below are useful starting points, but each has important exceptions.
| Observed activity | Typical directional clue | Important alternative |
|---|---|---|
| Calls traded at the ask | Potential aggressive call buying | Hedge, spread leg, or position closing |
| Puts traded at the ask | Potential aggressive put buying | Portfolio protection or spread leg |
| Calls traded at the bid | Potential aggressive call selling | Covered-call income or closing a long call |
| Puts traded at the bid | Potential aggressive put selling | Cash-secured put writing or closing a long put |
Bullish call buying
If TSLA is trading at $300 and repeated purchases appear in $320 calls at the ask, traders may be seeking upside exposure. The signal becomes more interesting when that demand is concentrated, sustained, and supported by the stock chart.
Bearish put buying
If AAPL is at $250 and large $235 puts repeatedly trade at the ask, participants may be seeking downside exposure. Yet an institution holding substantial AAPL stock could be buying the same puts as insurance rather than forecasting a crash.
Selling calls and puts
Selling calls can express a bearish or neutral view or generate covered-call income. Selling puts can express a neutral or bullish view or collect premium, but bid-side trades might also reflect investors closing prior long-put positions.
Why context matters
A $5 million put trade sounds bearish until you learn it is one leg of a larger hedging package. Look for paired transactions, repeated behavior, quote conditions, the broader market, catalysts, and whether the underlying price confirms the proposed direction.
Lesson 3 takeaway: Treat a flow print as a clue about trading pressure, not definitive proof of a participant's intention.
Lesson 4: The Five Criteria of High-Conviction Unusual Options Flow
Bullflow's Five-Criteria Flow Cheat Sheet is based on years of research into unusual options activity. It describes five screening characteristics: Aggressive, Focused, High Demand, Ask-Side Buying, and Sweeps. When several align, they may indicate a more coherent flow pattern, but their predictive value must be established through transparent historical testing.
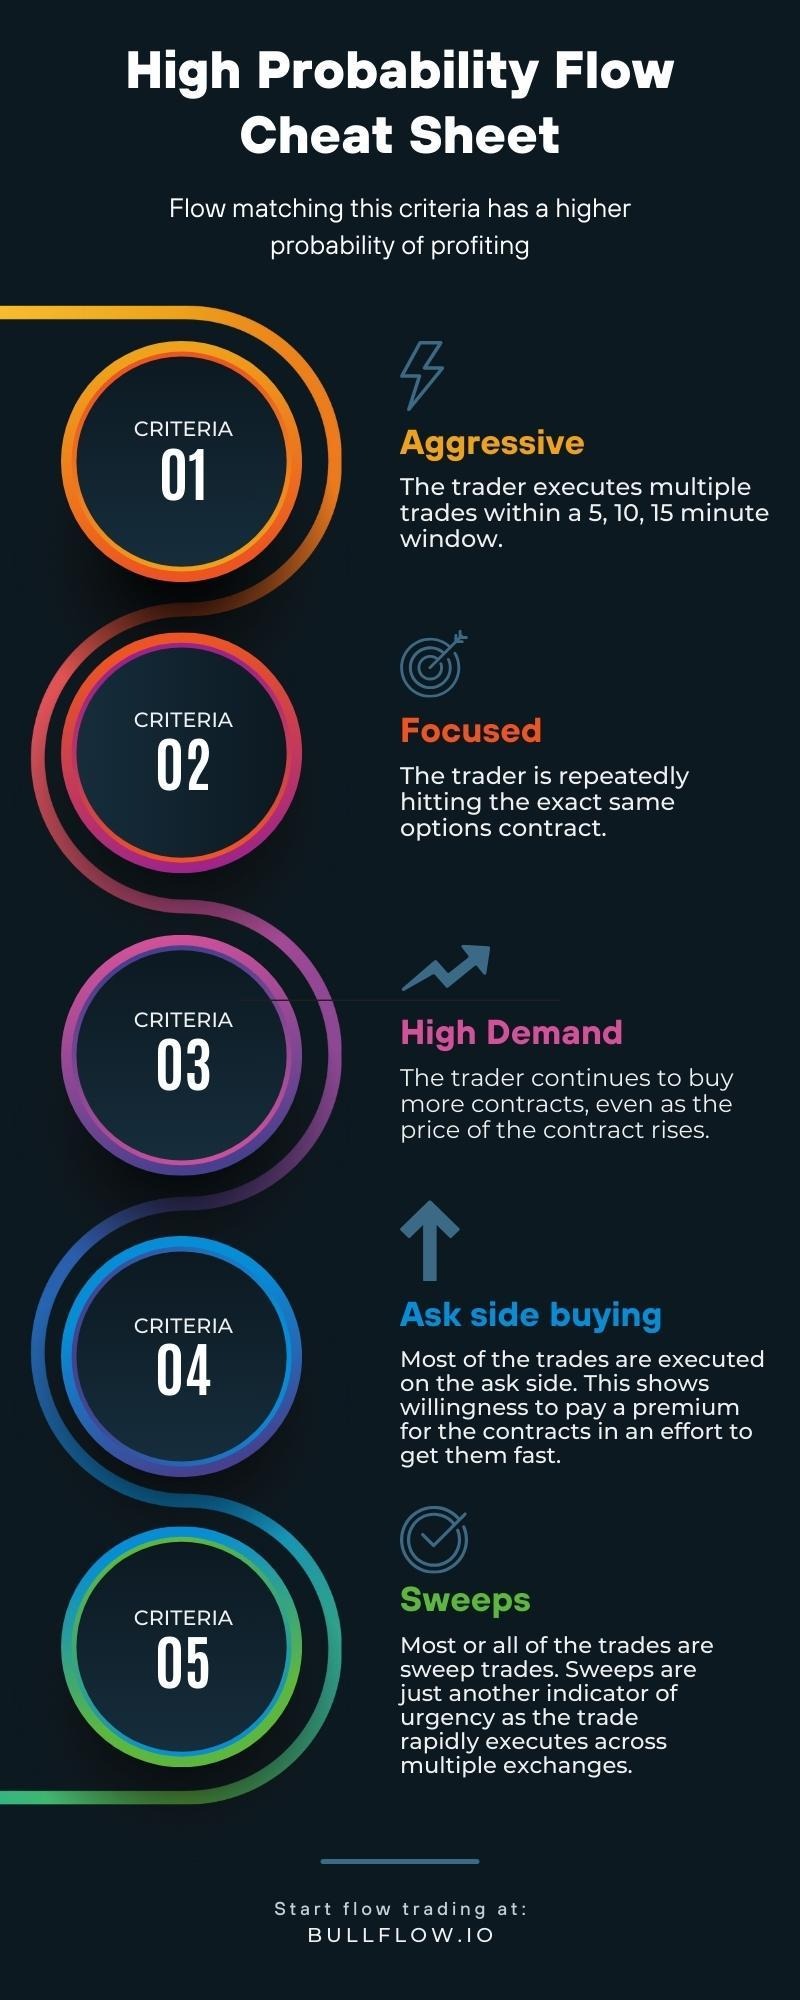
These criteria are a practical screening framework, not a statistical guarantee of a profitable trade. Several characteristics appearing together make a transaction pattern more coherent, but a good-looking signal still needs confirmation and risk management.
1. Aggressive: Multiple trades in a short period
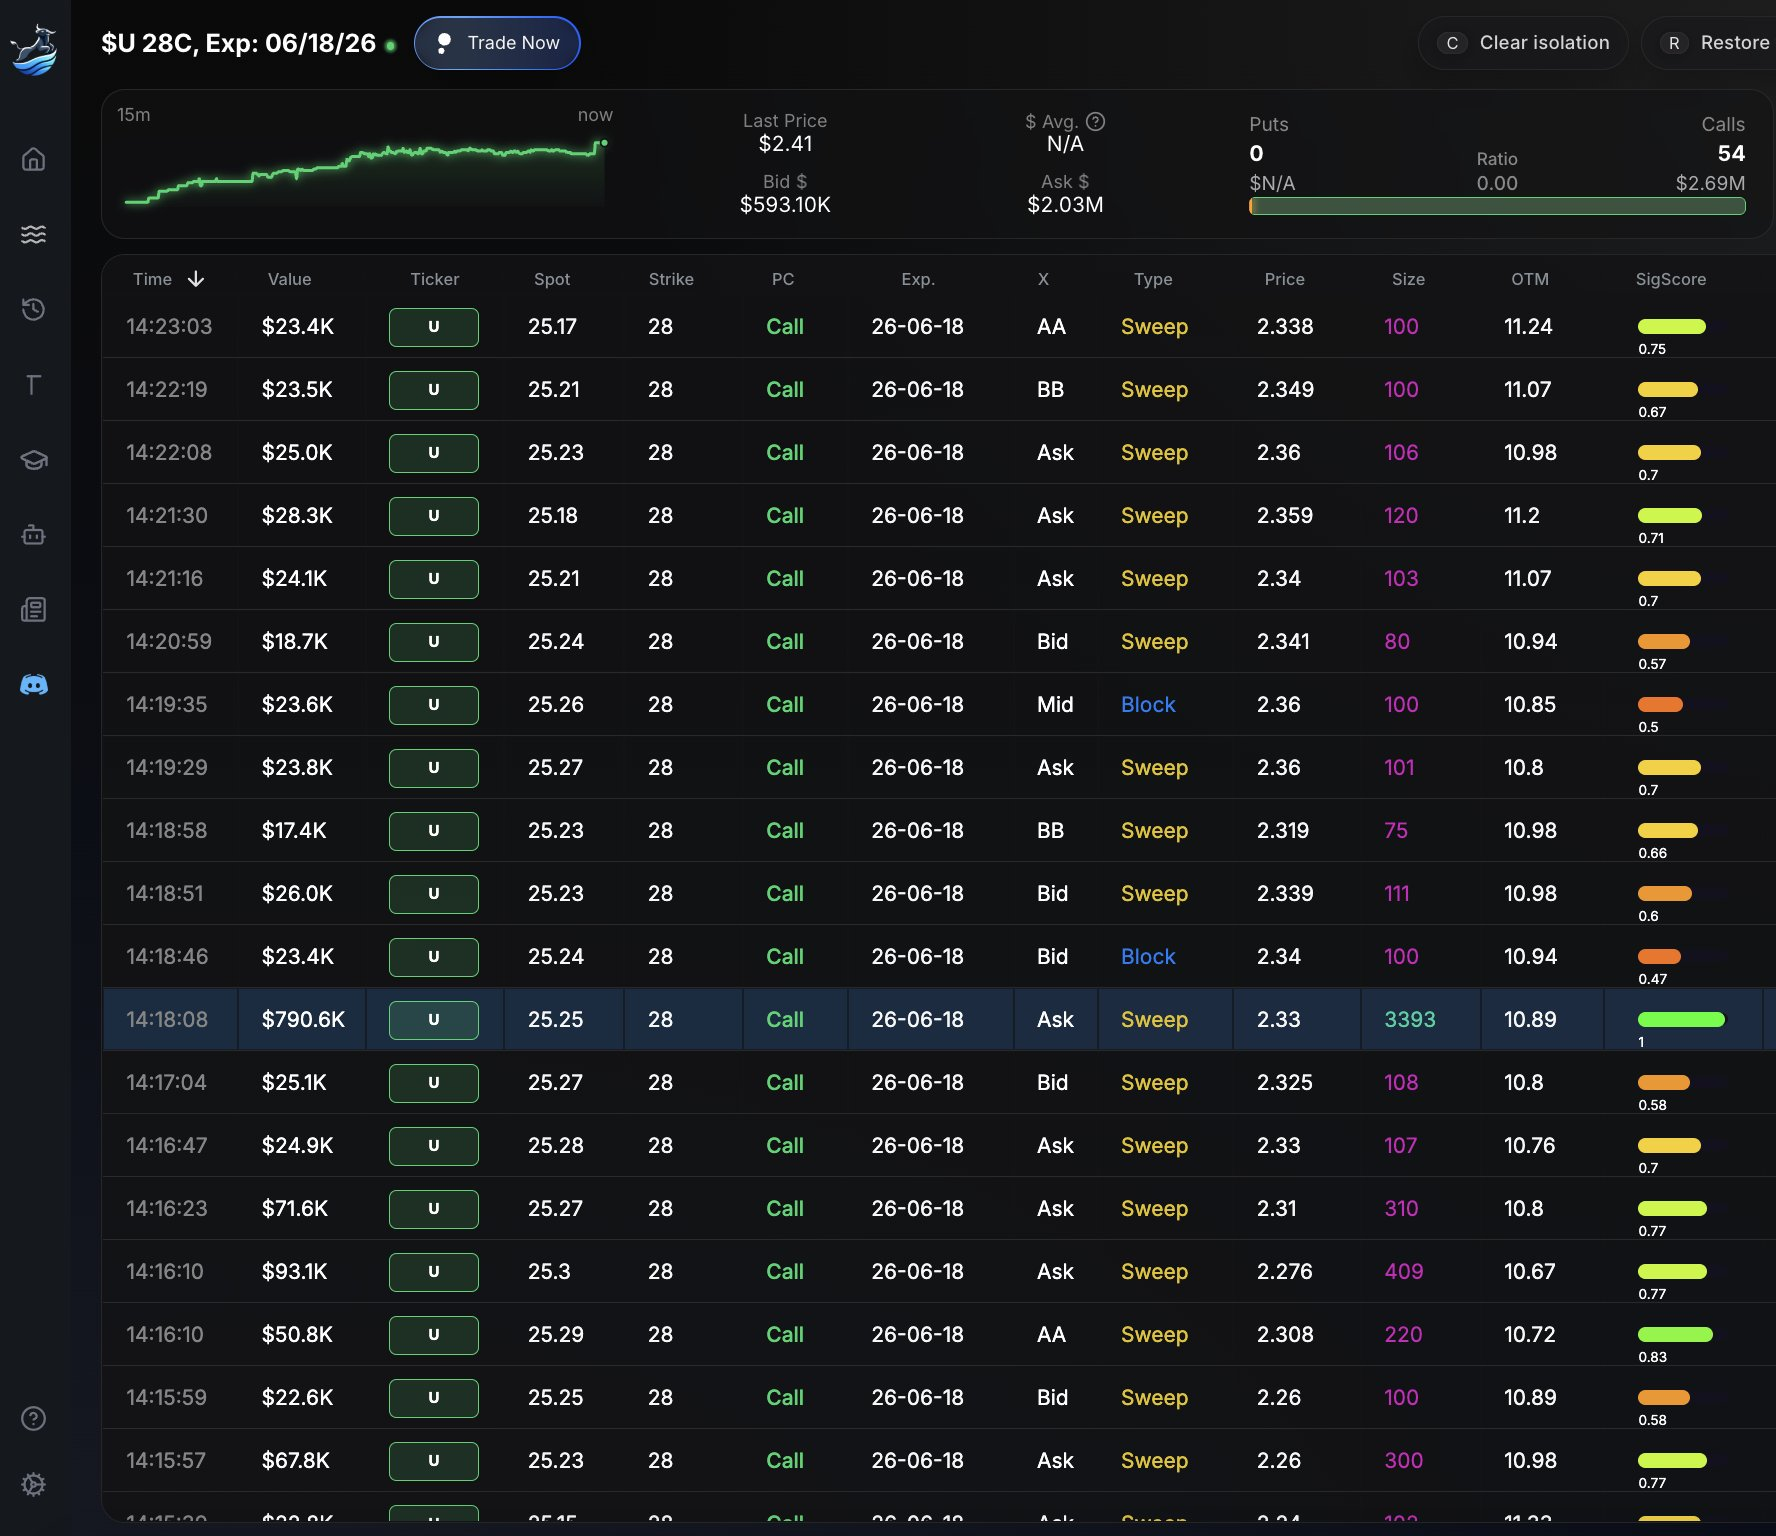
Aggressive flow involves repeated substantial trades within roughly a 5-, 10-, or 15-minute window. For example, $U sees 28 Strike calls coming in non stop from 14:15 to 14:23.
The repetition can reflect sustained demand, an execution algorithm, or portions of a larger order. It cannot establish that one trader originated all the prints.
What to look for: Several meaningful executions in a compressed timeframe, with a consistent direction rather than isolated trades.
2. Focused: Repeatedly targeting the same contract
Focused flow repeatedly hits the same ticker, call/put, strike, and expiration. These $U Calls were all hit with the same expiry repeatedly attracting volume while other strikes remain comparatively quiet.
Concentrated trading can suggest interest in a specific exposure and timeframe. Still, independent traders or algorithms can target the same contract for different reasons.
What to look for: Repeated activity in the exact same contract, not merely the same ticker.
3. High Demand: Buying as contract prices rise
High demand appears when aggressive buying continues as the option becomes more expensive. A contract might see ask-side transactions at $1.50, then $1.70, $1.95, and $2.20.
This persistence is worth investigating because buyers appear willing to continue paying up. Look for sustained buying pressure as traders continue accumulating the same contract even while its price rises. But option prices can rise due to the stock, implied volatility, or changing quotes. Rising premiums alone do not prove a fresh directional position is forming.
What to look for: Continued, substantial ask-side activity alongside rising option prices, preferably confirmed by underlying stock movement.
4. Ask-Side Buying:
If the quote is $3.00 bid / $3.15 ask, a transaction at $3.15 may reflect a buyer prioritizing immediate execution. One fill is ordinary; repeated sizable fills near the ask can be more informative.
Ask-side or above-ask classification is a useful proxy for buying aggressiveness, but it is not a guaranteed opening-buy indicator. A single ask-side Block trade does not hold the same weight as multiple, repeated ask-side Call sweeps.
What to look for: Predominantly ask-side or above-ask prints across several transactions in the same contract.
5. Sweeps: Urgency across exchanges
A sweep seeks liquidity across multiple exchanges to complete an order quickly. A trader looking to buy 2,000 calls may access several exchanges rather than just one.
Sweeps can indicate urgency. They can also result from routine electronic execution, hedging, or selling activity, so their value comes from the surrounding pattern.
What to look for: Repeated ask-side sweeps paired with focused, persistent demand and supporting stock-price action.
Putting all five criteria together
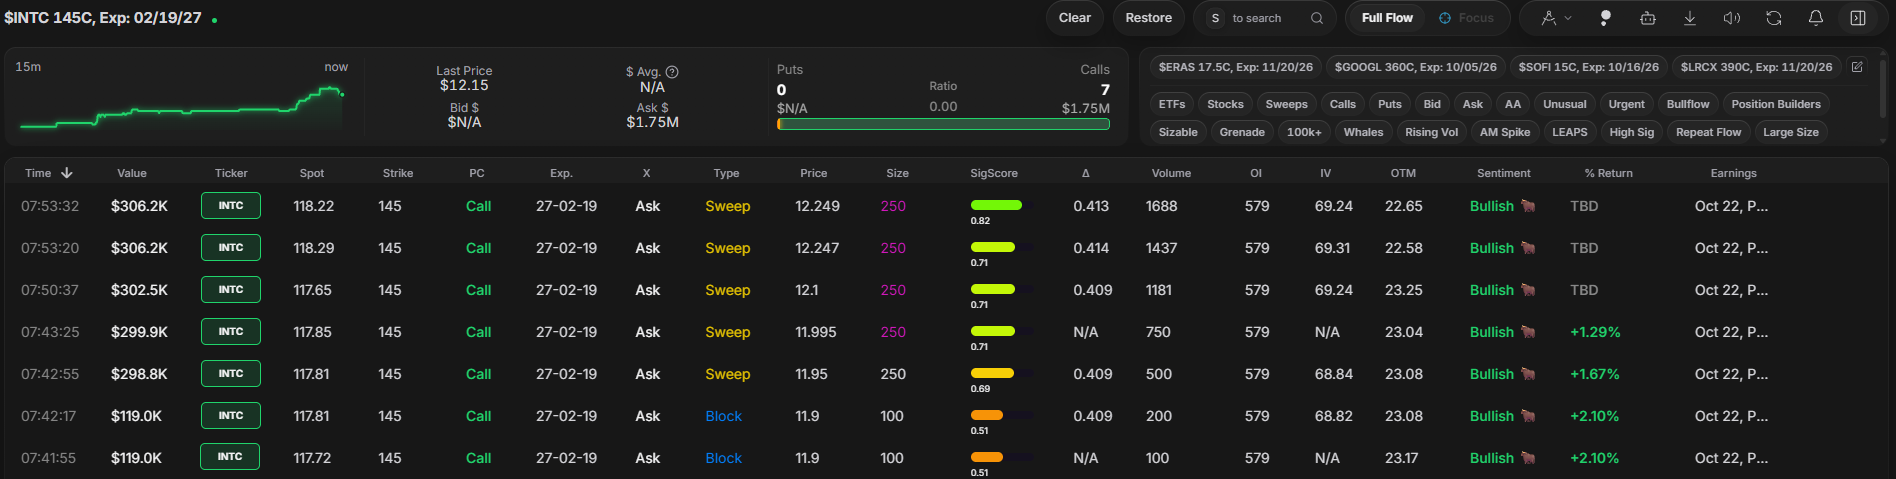
Here is an example of $INTC.
The combined premium of these trades is $1.75M. This example displays all five criteria: repeated activity in 12 minutes (aggressive); one specific contract (focused); trading at progressively higher option prices from 11.9 to 12.249 (high demand); executions near the offer (ask-side buying); and multi-venue execution (sweeps).
That provides a more interesting research lead than one isolated print. The next step is to check the underlying chart, potential paired trades, liquidity, volatility, news, earnings and what might invalidate the trade thesis. It’s important to note: unusual options flow ahead of an earnings report does NOT predict how a company’s stock will react after earnings.
Five-criteria checklist
- ☐ Aggressive: Several large prints within 5–15 minutes.
- ☐ Focused: Same contract, strike, and expiration.
- ☐ High Demand: Continued buying despite increasing option prices.
- ☐ Ask-Side Buying: Repeated transactions near the offer.
- ☐ Sweeps: Urgent executions seeking liquidity across exchanges.
Lesson 4 takeaway: The most useful flow isn't necessarily the largest. It is activity with a consistent, interpretable pattern plus independent confirmation.
Lesson 5: Separating Meaningful Flow From Market Noise
Bigger isn't always better
A $10 million call block near the midpoint with no follow-up may be harder to interpret than $750,000 of concentrated ask-side sweeps in a less active stock that is breaking above resistance. Analyze trade behavior relative to its normal market context.
Watch for multi-leg structures
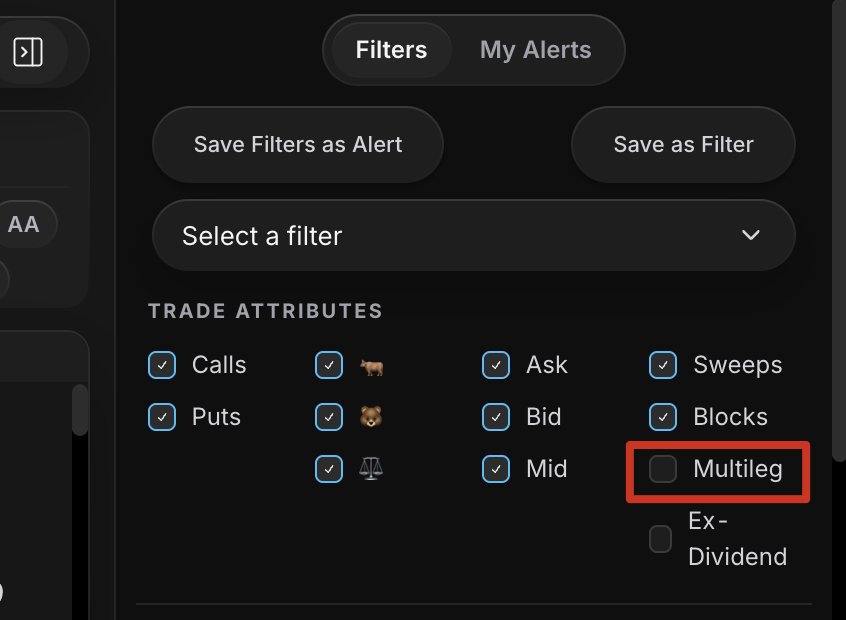
A $2 million call purchase alongside a $1.5 million call sell at a different strike could be a vertical spread. Evaluating only the purchase may exaggerate the participant's conviction and potential risk. In order to see multi leg trades, enable them in the filters section of your Bullflow Dashboard. Multi-leg trades are unchecked by default in the filters.
Recognize rolls and position adjustments
A trader may close an existing contract and simultaneously open another with a different expiration or strike. This is commonly called a roll. For example, selling near-term $100 calls while buying later-dated $105 calls may extend or reshape exposure rather than initiate an entirely new bullish bet.
What to look for: Similar size, nearly simultaneous timestamps, the same underlying, related expirations or strikes, and prints with offsetting directions. Some legs are reported separately, so do not assume a standalone call purchase shows the whole strategy.
Identifying a Potential Options Roll
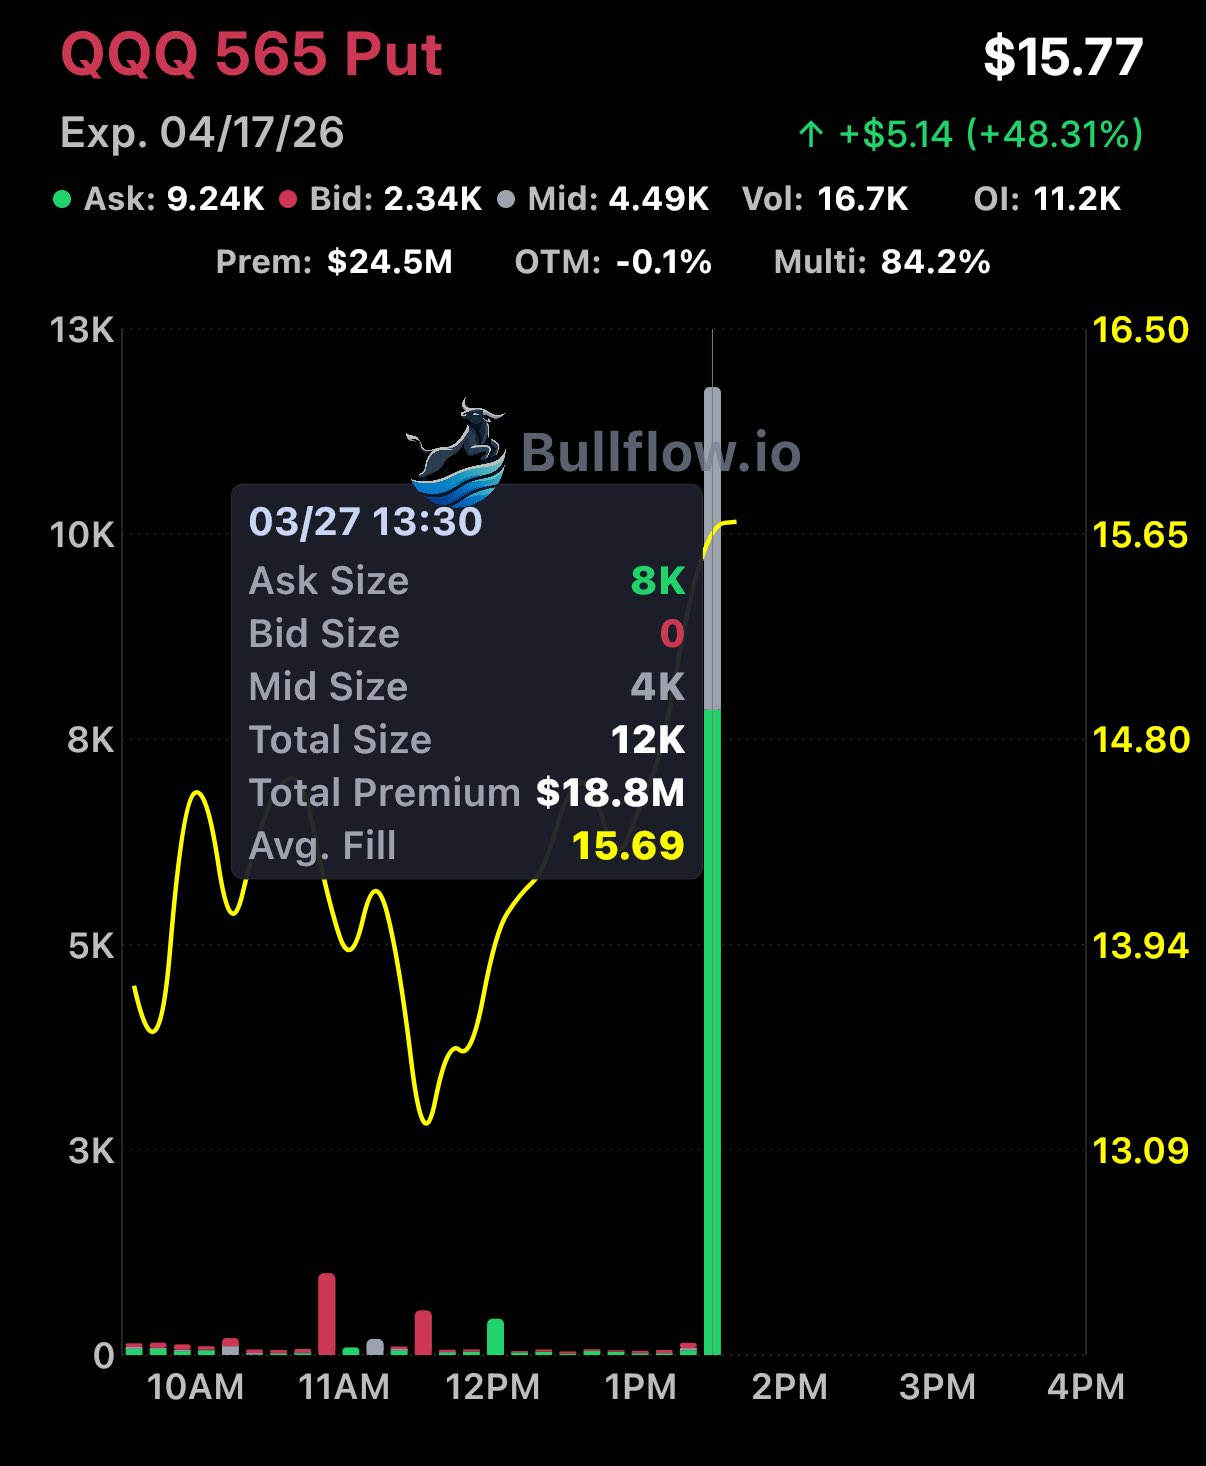
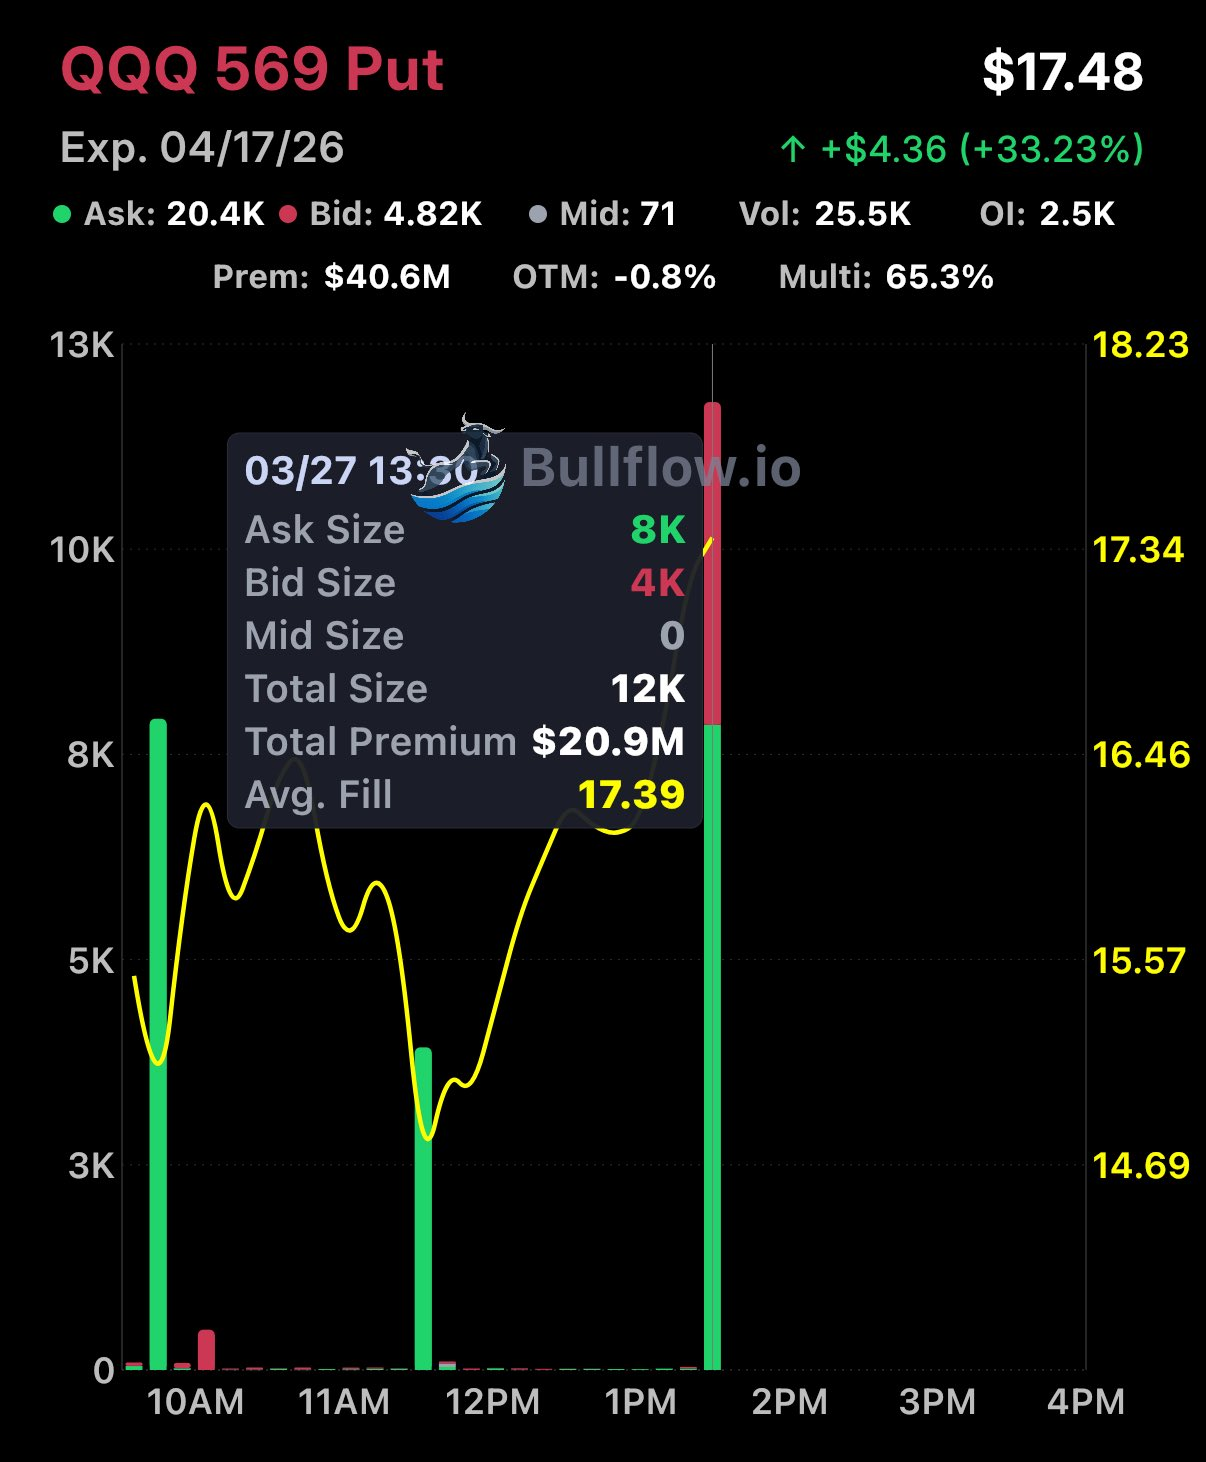
In this example, two QQQ put contracts experienced unusually large transactions at approximately the same time, with 12,000 contracts traded in each around 1:30 PM.
The matching trade sizes, timing, and high percentage of multi-leg activity suggest these transactions may be connected. This could indicate an options roll, where a trader closes an existing position and simultaneously opens another at a different strike price or expiration date.
Rather than representing two independent bearish bets, the activity may simply reflect a trader adjusting or extending an existing position.
Watch Out for Ex-Dividend Flow
Not all large options trades represent directional bets. Around a stock's ex-dividend date, institutions may execute massive options transactions as part of dividend-related strategies rather than speculation.
These trades often involve deep in-the-money (ITM) calls, large block orders, and millions of dollars in premium. While they may initially appear to signal aggressive bullish activity, they can simply reflect institutions adjusting positions, exercising calls, or executing dividend arbitrage strategies.
For example, Bullflow previously identified $53 million in MCD call activity that appeared highly bullish but was actually related to dividend positioning.
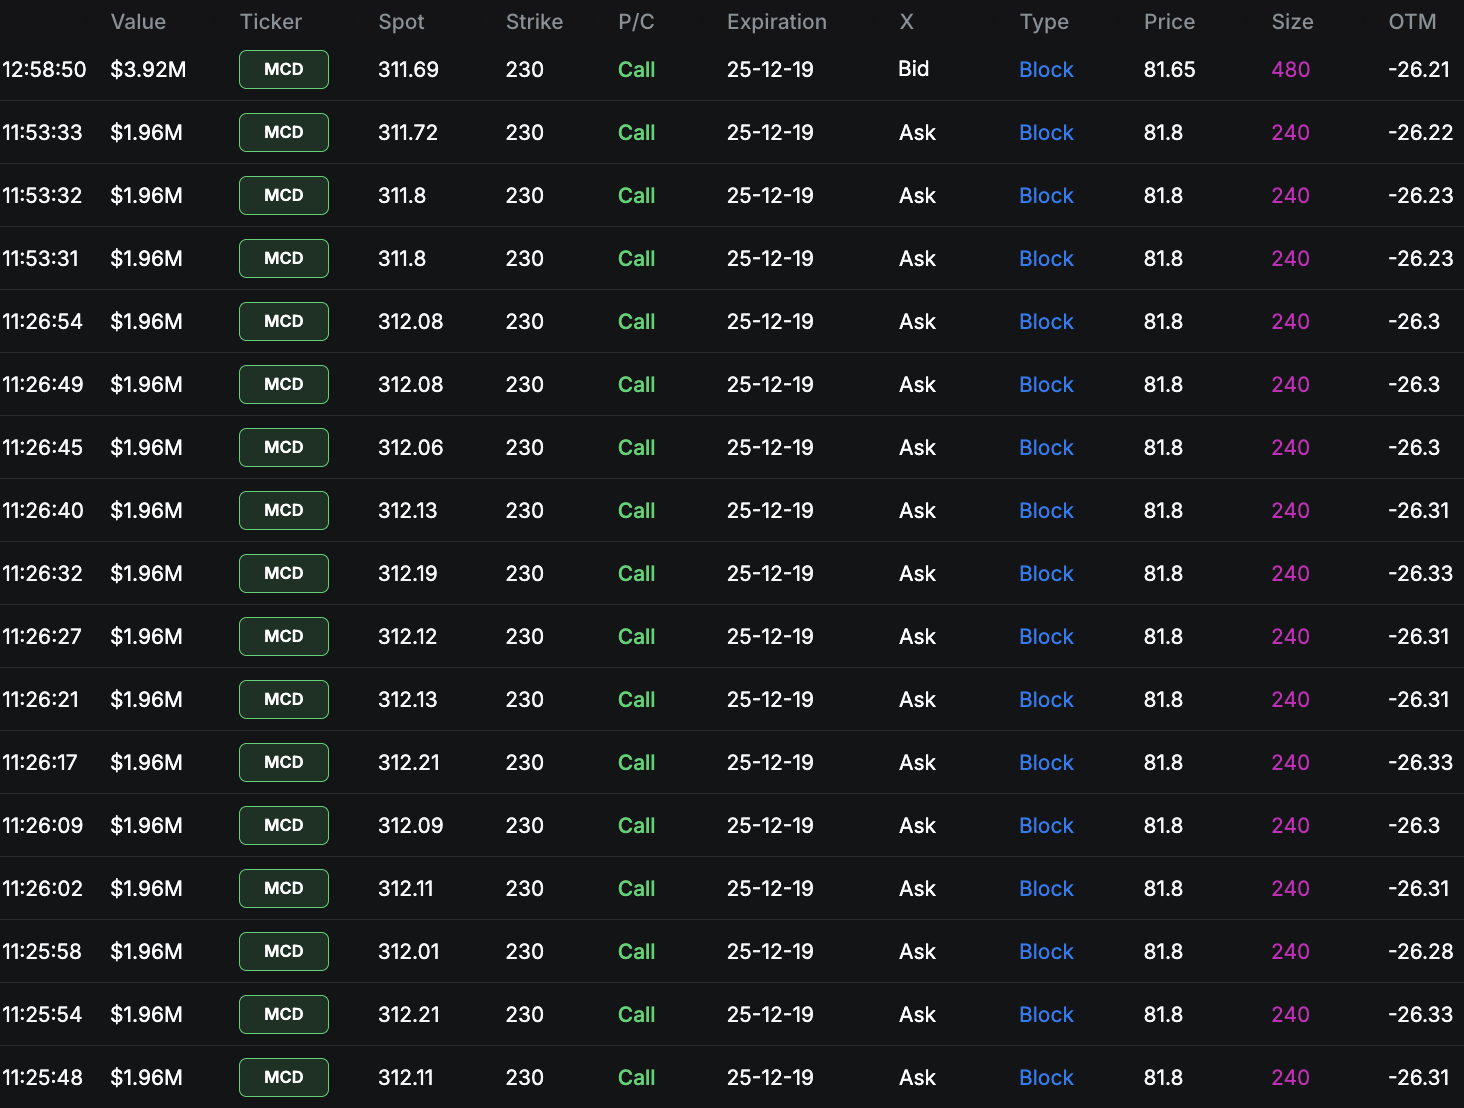
Bullflow excludes ex-dividend flow by default to help reduce misleading activity in the scanner. Traders can manually enable the Ex-Dividend filter to view these transactions.
For a detailed breakdown, read our Guide to Understanding Ex-Dividend Options Flow.
Earnings and implied volatility
Before an earnings announcement, traders may buy volatility rather than direction. Implied volatility can fall sharply after the event. Consequently, a stock can move in the predicted direction while an option purchase still loses money if the move is insufficient.
Expiration and Greeks
Delta indicates option sensitivity to the underlying price; theta describes sensitivity to passing time; vega measures sensitivity to implied volatility. Very short-dated options can change value extremely fast. The contract seen in the flow may not be suitable for your trading style or time horizon.
Confirm with the stock chart
Options flow becomes more meaningful when supported by additional technical confirmation. Independent technical confirmation can strengthen a setup without eliminating risk. Look for the stock breaking above resistance, losing key support, showing relative strength, or experiencing unusually high trading volume.
Ask whether the observed options activity has a plausible catalyst. A bullish call pattern in a stock making lower lows requires more skepticism than the same pattern alongside an established breakout.
Common mistakes that make attractive flow misleading
- Chasing stale alerts: A contract purchased aggressively at $1.50 may be unattractive after it has already repriced to $3.00.
- Relying on a single block trade: An isolated block trade provides little directional insight without repeated activity or additional confirmation.
- Ignoring liquidity: A wide bid/ask spread can consume a large portion of a projected gain.
- Treating every sweep as a new directional position: Sweeps can be hedges, closes, or pieces of a multi-leg strategy.
- Ignoring the underlying trend or catalyst: Strong prints without price confirmation may be noise or protection.
- Confusing a large premium with a known loss limit: Selling and complex strategies have exposures that cannot be inferred from premium alone.
Lesson 5 takeaway: Avoid conclusions from single prints. Check for spread legs, hedges, event risk, volatility, and price-action confirmation.
Lesson 6: How to Analyze Unusual Options Flow With Bullflow
Start with the live flow scanner
Bullflow's options flow feed helps traders evaluate ticker, contract, size, premium, volume, open interest, and trade execution. Narrow the view using relevant filters rather than monitoring every print.
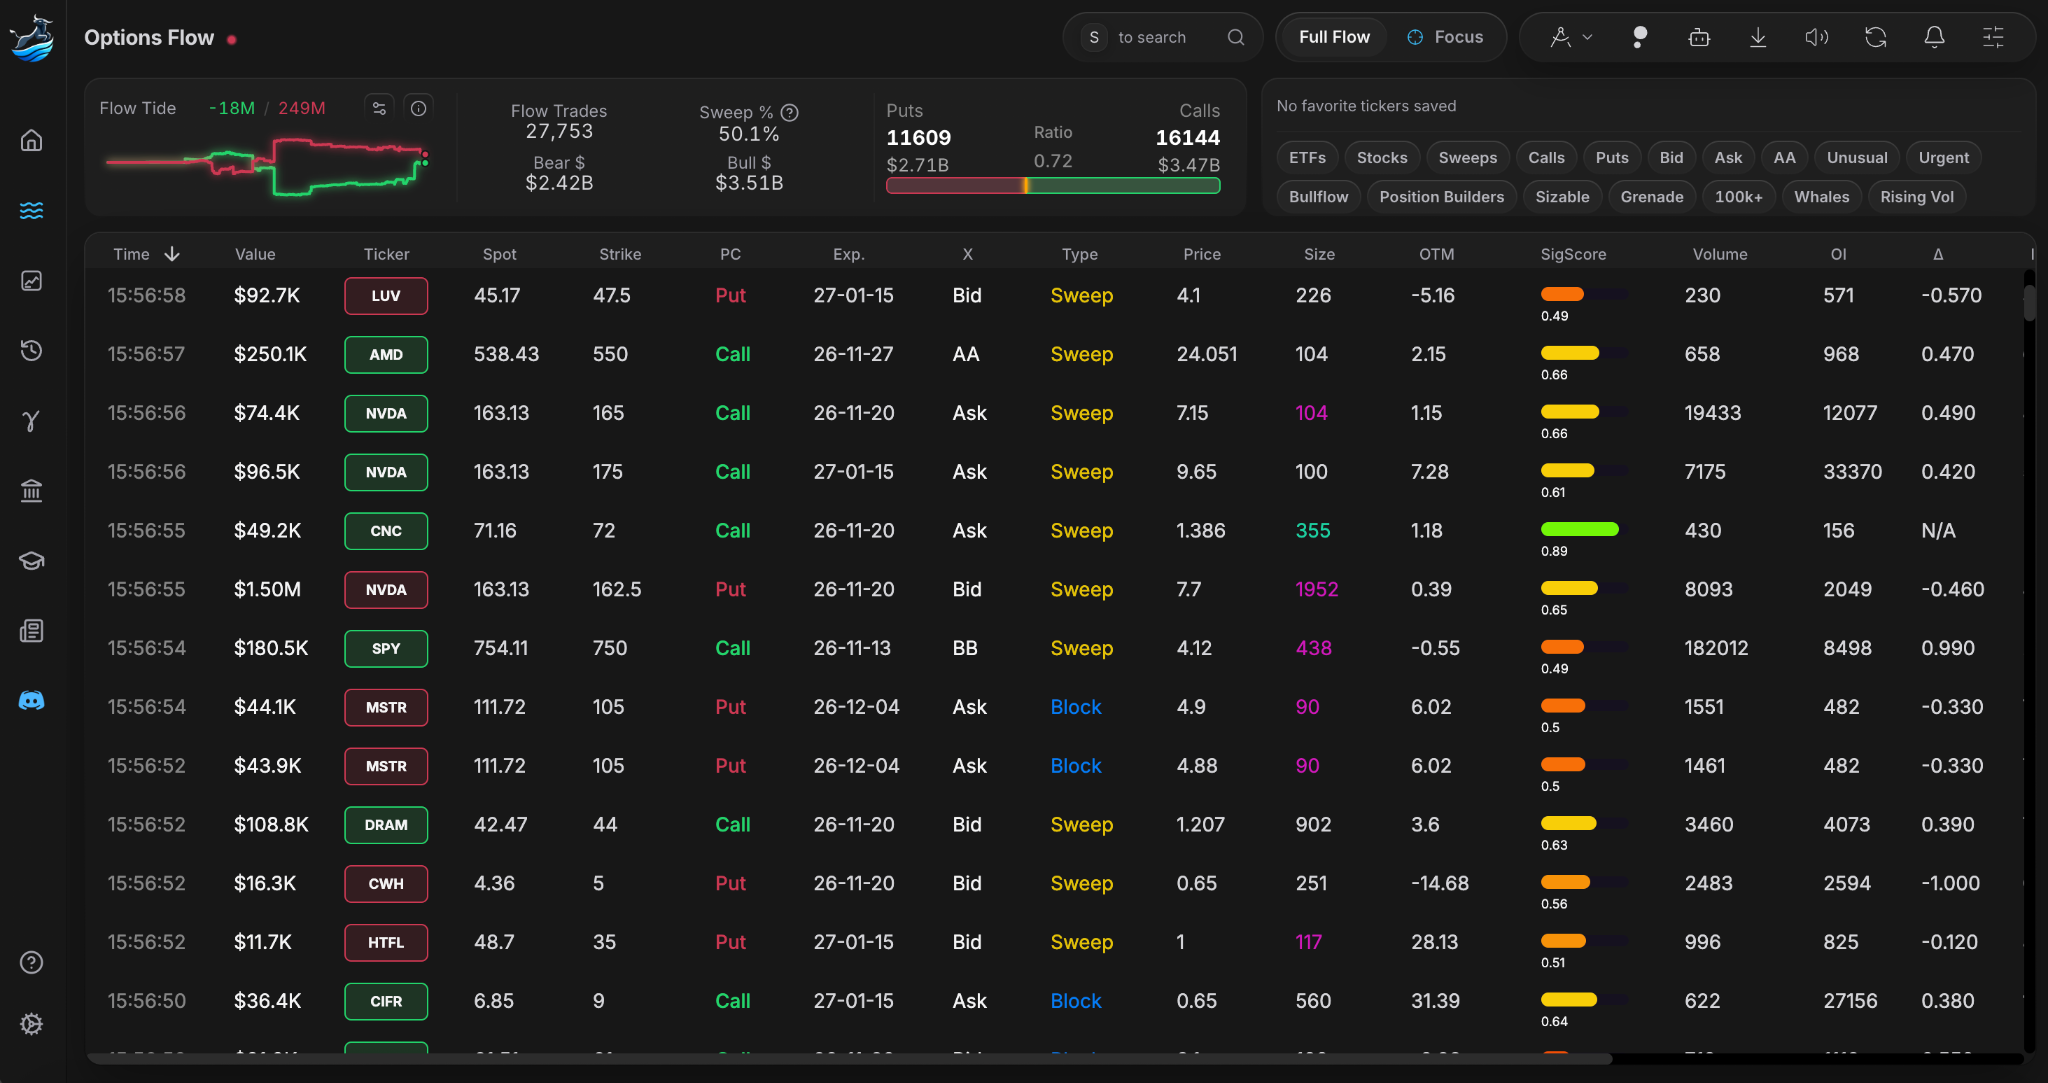
A first-pass scanner workflow
- Choose a hypothesis, such as aggressive call buying over the next several weeks; set contract type, a sensible premium threshold, DTE, ask-side execution, and sweep filters.
- Check SigScore and activity relative to the ticker’s normal baseline, then isolate the same contract to look for repeated prints over 5–15 minutes.
- Inspect the chart and contract quote; confirm that the options are actually becoming more expensive and that the underlying is behaving consistently with the thesis.
- Check for related put or call legs, earnings, dividends, and whether the trade could be a roll or hedge before saving an alert.
Filter reminder: Multi-leg and ex-dividend classifications are unchecked by default in Bullflow. Enable either deliberately when you need to review potentially misleading or complex flow.
Use SigScore as a research filter
Bullflow's SigScore, on a 0-to-1 scale, ranks unusualness according to the platform's scoring methodology. A higher SigScore can prioritize investigation, but it does not represent the probability a trade will be profitable.
Filter for the patterns you care about
Focus on premium size, expiration, calls or puts, execution type, volume/OI relationships, and unusualness. Bullflow also includes filters and categories that help surface time-sensitive, substantial, and distinctive activity. Start broad enough to discover new opportunities, then refine your criteria to reduce noise.
Monitor focused contract activity
Once a contract stands out, inspect follow-up prints in the same strike and expiration. Determine whether executions continue, contract prices move, and the underlying stock confirms the apparent direction.
Review net premium and broader flows
Individual trades tell you what happened at one moment. A net premium view can help reveal whether classified call and put buying/selling pressure appears sustained or reverses throughout the session. Remember that classification reflects observed execution behavior rather than the complete positions of the participants.
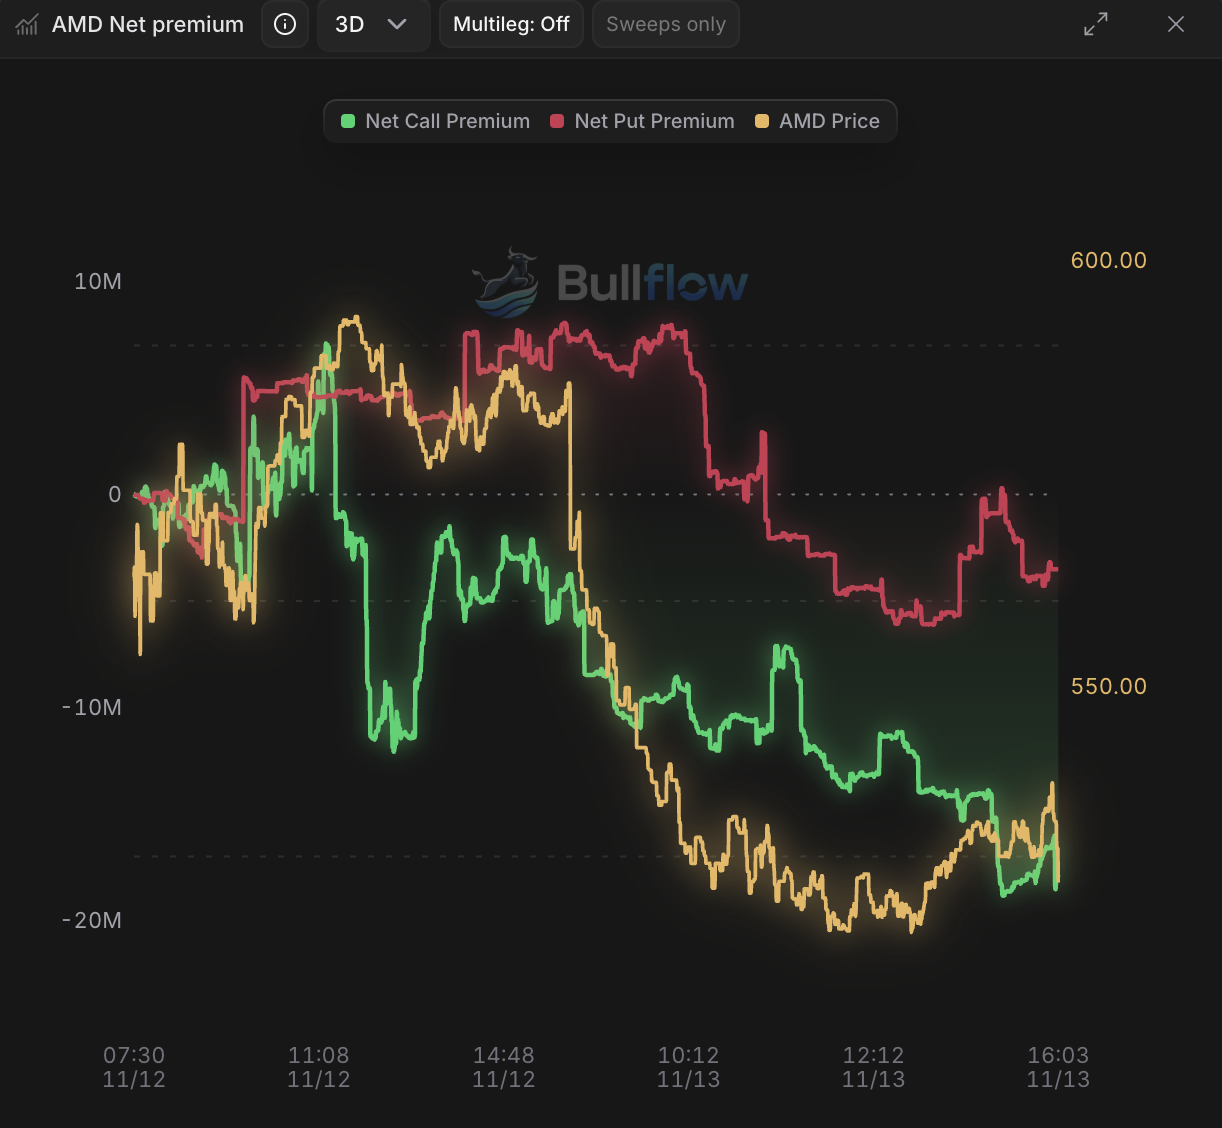
Combine options flow with GEX
Options flow highlights transactions; Gamma Exposure (GEX) estimates how options positioning might interact with dealer hedging and underlying-price behavior. Consider whether your flow thesis aligns with important GEX levels, resistance, support, and the broader market regime. GEX estimates depend on assumptions and cannot perfectly reconstruct dealer inventories.
For more context, see Bullflow's Complete Guide to Gamma Exposure.
Use alerts and historical review
Custom alerts can help surface criteria-matching activity without constantly staring at the scanner. Historical flow is useful for studying what happened after strong-looking signals, including the many times they failed.
Real-World Examples: Reviewing Unusual Options Flow
Analyzing historical options flow is a great way to develop your understanding of unusual trading activity. In this video, we review several notable options flow transactions identified through Bullflow and discuss the opportunities they presented.
Lesson 6 takeaway: Use Bullflow to find unusual patterns, then validate them across contract behavior, stock price, risk, and other indicators.
Lesson 7: Turning Flow Into a Repeatable Trading Workflow
Step 1: Identify the candidate
Look for substantial, unusual, concentrated activity. The five-criteria checklist can help prioritize what deserves a closer look.
Step 2: Build a thesis
Is the pattern potentially bullish, bearish, neutral, or ambiguous? Might the trades be part of a hedge, spread, or closing transaction? Don't force a confident interpretation when the tape does not support one.
Step 3: Confirm the underlying setup
For a bullish breakout, look for focused call demand while price clears resistance with improving stock volume. For a bearish breakdown, look for focused put demand while price loses support. Market conditions and catalysts matter for both.
Step 4: Evaluate the instrument
Consider spread width, expiration, delta, volatility, event risk, and liquidity. Copying the identical contract from the flow is not necessarily the best expression of the thesis for your account.
Step 5: Understand the risks
A thesis built on options flow can be wrong, so it helps to know in advance what would invalidate it. A purchased option can lose its entire premium; multi-leg and short-option positions may involve additional risks.
Step 6: Monitor and reassess
Does the flow continue in the same contract? Is competing activity increasing? Has the stock reversed at a key level? Exit based on your predefined plan, not on a desire to be on the same side as a presumed institution.
Step 7: Review both winners and losers
Keep a journal of the pattern, catalyst, entry, expiration, underlying stock action, and trade result. The five criteria offer a screening hypothesis; your own structured review and testing determine whether it has value in a specific market and strategy.
Three flow setups to research
Bullish breakout continuation — Look for repeated ask-side call sweeps in one contract while the stock clears a tested resistance level with increasing stock volume. Traders often watch whether the stock holds above resistance or loses that level. Watch for spreads, overstretched option pricing, and failed breakouts.
Bearish breakdown continuation — Look for concentrated ask-side put activity as the stock loses support with relative weakness. Traders often watch for a breakdown and failed retest, or a recovery of support. Protective put buying and volatility spikes can imitate bearish conviction.
Pre-catalyst accumulation — Look for sustained contract-specific flow ahead of a known date, then compare time to expiration, implied move, and IV. The research decision may be to watch, reduce size, or avoid taking a long option through the event. The flow does not reveal the earnings result.
Real-World Example: Identifying an Options Flow Trade
Let's look at a real-world example of how unusual options flow can help identify a potential trading opportunity. In this video, we break down an AAL trade identified through Bullflow and explain the reasoning behind the entry.
$AAL Trade Entry | Spot Winning Options Flow Trades
Lesson 7 takeaway: Flow works best as one input into a consistent, risk-defined process.
Frequently Asked Questions
Does unusual options flow predict stock prices?
No individual print or pattern can reliably predict the future price of a stock. Flow can help identify areas of demand and potential positioning, but it requires independent confirmation.
Is buying calls always bullish?
No. A call purchase may be directional, protective within another structure, or part of a complex strategy.
What does volume greater than open interest mean?
It means today's trading volume exceeds the contracts outstanding in the most recent OI report. It highlights turnover, but does not by itself establish new position creation.
Are sweep orders bullish or bearish?
Either. The sweep label primarily describes execution across multiple venues. The option type, side, and surrounding transactions matter.
Is a higher SigScore a higher chance of winning?
No. SigScore is an unusualness indicator, not a calibrated win-probability estimate.
Which unusual options activity is worth researching?
There is no universally best pattern. Many traders begin with aggressive, focused, high-demand, ask-side activity and sweeps, then check the stock chart, volatility, liquidity, and risk.
Can beginners learn options flow?
Yes. Begin by observing and documenting patterns without trading them. Learn options pricing, bid/ask mechanics, OI, expiration, and the potential for total premium loss before committing capital.
Quick glossary: common unusual options flow terms
- Premium: Dollar value of the options transaction, generally contracts × quoted option price × 100 for standard equity options.
- Open interest (OI): Contracts outstanding after the latest clearing cycle, distinct from today’s trading volume.
- Volume/OI: Today’s contract turnover compared with previously outstanding contracts; it does not prove opening buys.
- Bid / ask / midpoint: Quoted prices to buy/sell and their average; execution location can suggest who was aggressive.
- Sweep / block: Execution routed to multiple venues for speed versus a comparatively large reported single fill.
- ITM / ATM / OTM: In the money, at the money, and out of the money relative to the underlying price.
- DTE: Days until expiration, a key factor in time decay and whether the trade fits the thesis.
- Delta / gamma: Option sensitivity to a stock-price move and the rate at which delta changes.
- Theta / vega: Option sensitivity to passing time and changes in implied volatility.
- Implied volatility (IV): The volatility assumption embedded in market option prices; not a directional forecast.
- Net premium: An execution-classification-based estimate of option buying and selling pressure, not a full institutional inventory.
- SigScore: Bullflow’s unusualness ranking from 0 to 1; not an estimated probability of profit.
- Multi-leg / roll: Related options legs within one strategy; a roll generally closes or reduces one exposure while opening another.
- Ex-dividend: The date on which a stock begins trading without entitlement to its next declared dividend; option activity near it may reflect dividend mechanics.
Final Thoughts: Read the Options Flow, Not Just the Price
Unusual options flow can reveal where activity is developing, but it is not a shortcut around analysis. The most useful observations tend to combine aggressive, focused, high-demand, ask-side buying and sweep activity with clear market context.
Use the cheat sheet as a research checklist. Then confirm the setup with the underlying chart, examine possible alternative interpretations, and manage risk independently.
Explore unusual options activity in Bullflow’s real-time scanner.
Make sure to join the Bullflow Discord for more educational materials and check out the Bullflow Youtube channel for video learning at https://www.youtube.com/@Bullflow
Educational material only. Options involve substantial risk, including the possibility of losing the entire premium paid. Examples are hypothetical, and historical patterns do not guarantee future results.